
Introduction:
Welcome to our analysis of student performance in exams! In this blog post, we explore the factors that contribute to academic success by examining a comprehensive dataset. Join us as we uncover intriguing patterns and gain valuable insights into the educational landscape.
Based on this scenario, here are three things the stakeholder wanted:
#Achievement Gap Analysis:
The stakeholder would want to understand if there are significant achievement gaps among different demographic groups (e.g., gender, race/ethnicity) based on the exam scores. They would be interested in identifying any disparities in performance and determining whether certain groups are at a disadvantage. This analysis would help the stakeholder address equity issues and design targeted interventions to bridge the achievement gap.
#Test Preparation Assessment:
The stakeholder would be interested in evaluating the effectiveness of the test preparation course. They would want to analyze the performance of students who completed the test preparation course compared to those who did not. This assessment would provide insights into whether the course positively impacts exam scores and if it is a valuable intervention for improving student performance.
#Impact of Parental Education:
The stakeholder would like to investigate the relationship between parental level of education and student performance. They would want to analyze how parental education influences exam scores and determine if students with highly educated parents tend to perform better. This analysis would provide insights into the importance of parental involvement and potentially guide strategies for engaging parents to support their children’s educational journey.
Methodology:
To conduct our analysis, we utilized a dataset containing information on students’ math, reading, and writing scores, along with variables such as gender, race, parental level of education, lunch provided, and test preparation course. The dataset was carefully prepared, including renaming columns with two words separated by an underscore.
Key Visualizations and Analysis:
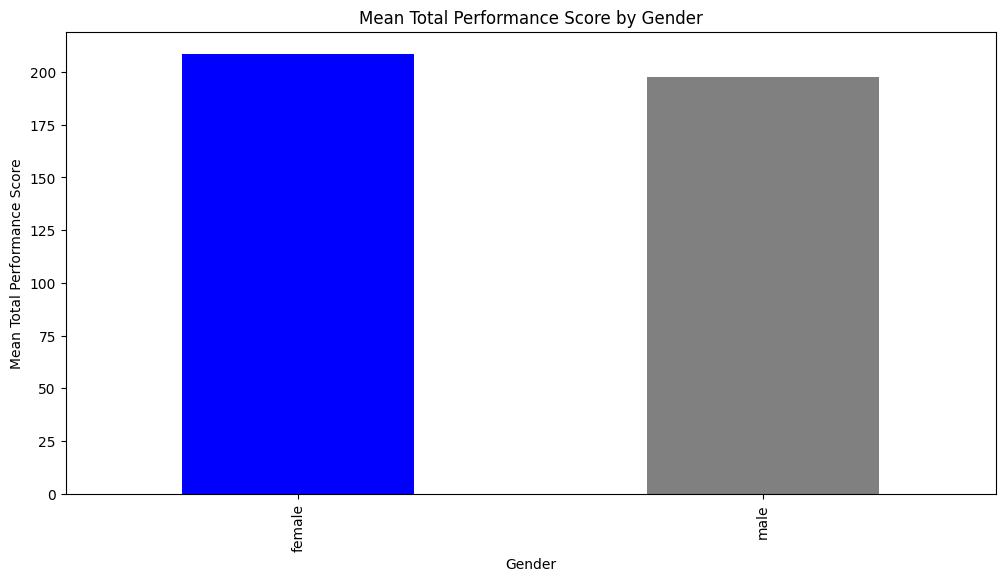
- Mean Performance by Gender:
- By plotting the mean performance by gender, we discovered an interesting pattern. Females displayed a higher average total performance compared to males. This observation prompts further exploration into potential social or environmental factors that may influence gender disparities in academic achievement.
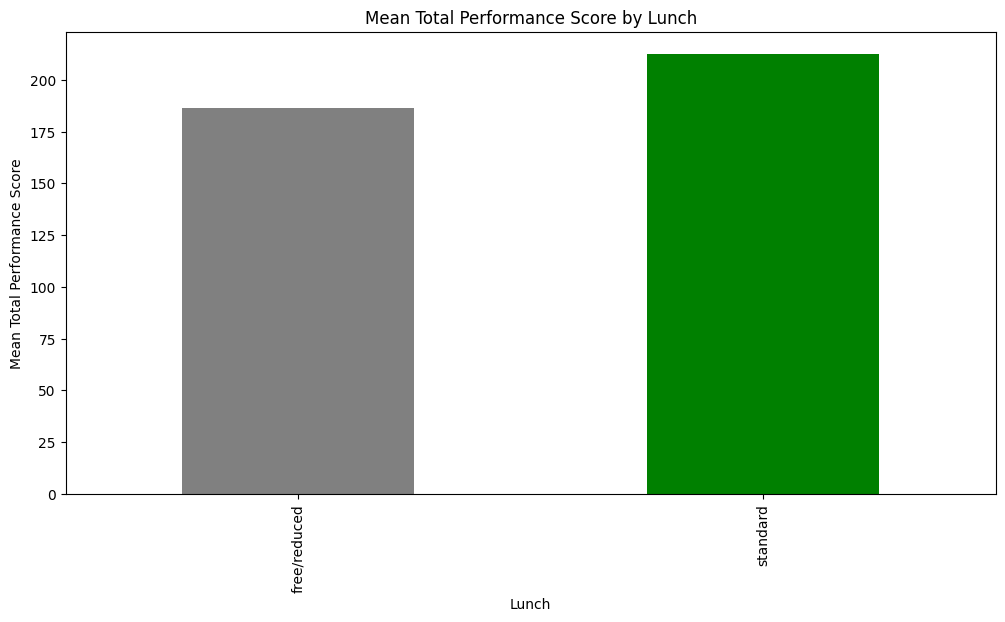
- Mean Performance by Lunch Provision:
- Nutrition plays a crucial role in academic performance, and our analysis revealed a compelling trend. Students receiving standard lunch provision exhibited higher average total performance compared to those without or with reduced lunch provision. This finding underscores the importance of addressing disparities in lunch provision and ensuring all students have access to nutritious meals.
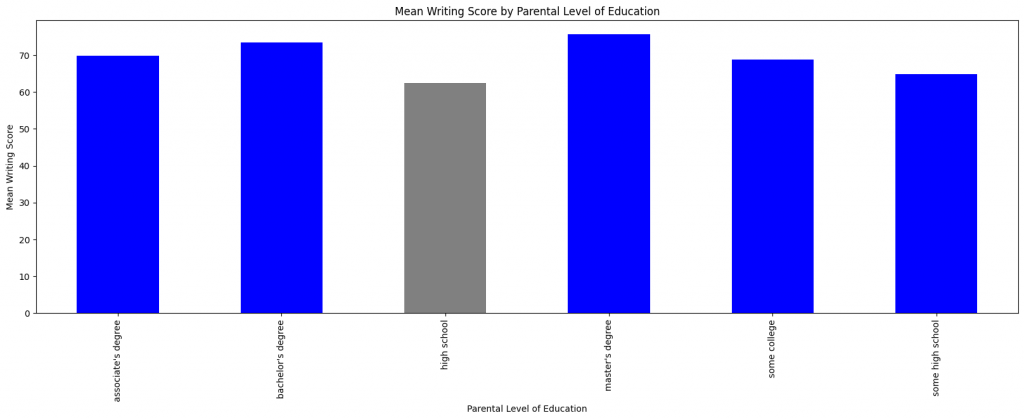
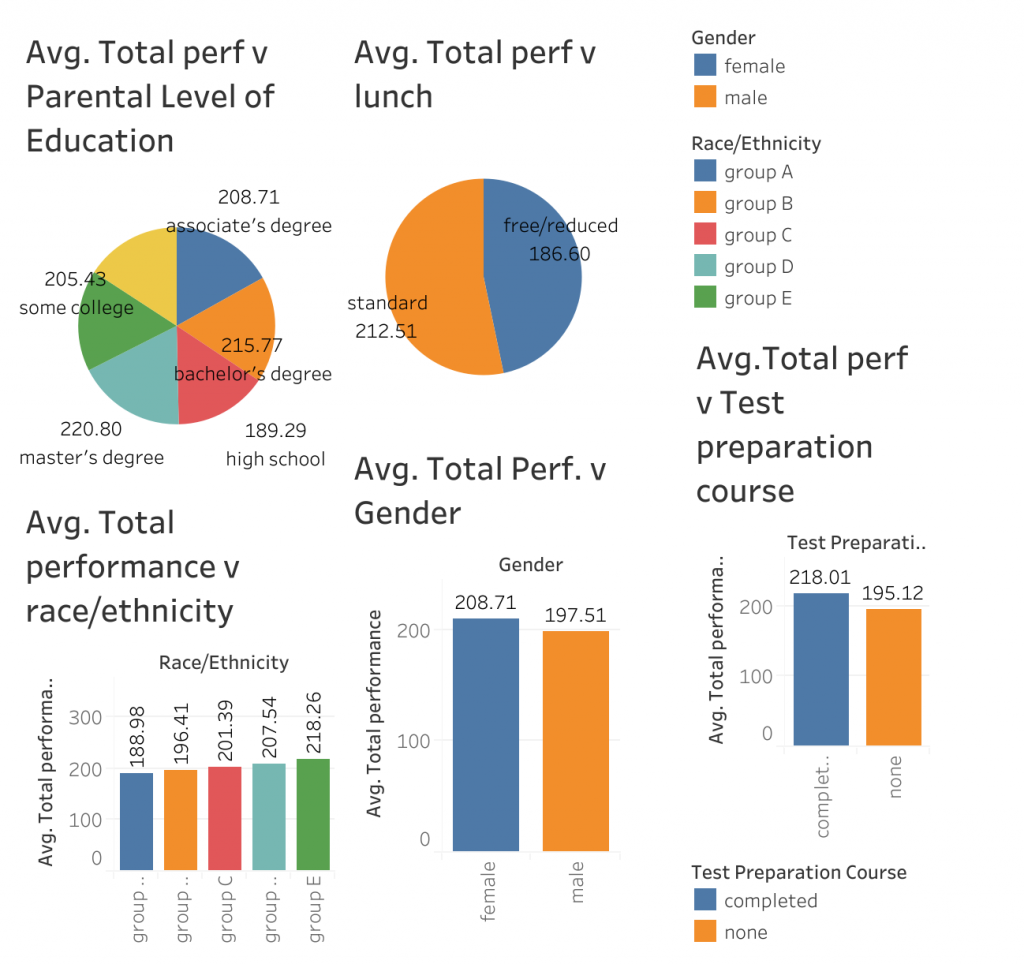
- Mean Performance by Parental Level of Education:
- Parental education is a significant factor influencing student outcomes. By examining mean performance based on parental level of education, we uncovered valuable insights. The pie chart representation showcased the distribution of mean performance across different education levels. Students with parents holding master’s or bachelor’s degrees displayed relatively higher average total performance. It is crucial to ensure equitable access to resources and support for students from all educational backgrounds.
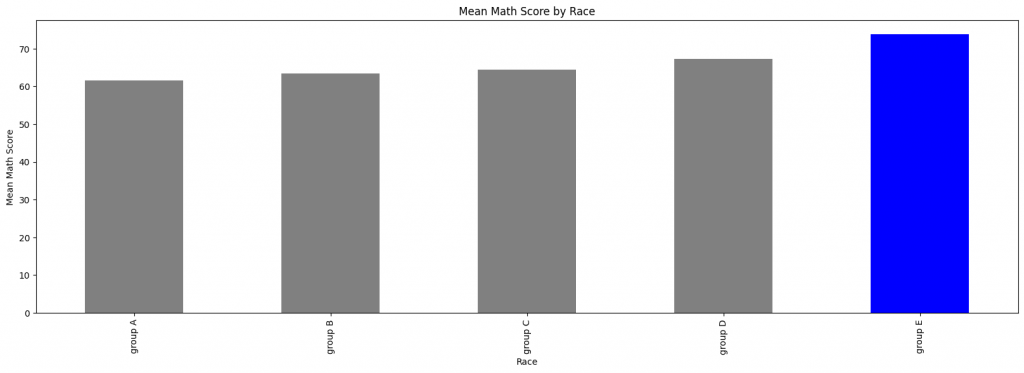
- Mean Performance by Race:
- Race also plays a role in student performance, and our analysis shed light on this aspect. By analyzing mean performance across racial groups, we identified noteworthy patterns. The pie chart visually presented the distribution of average total performance among different racial groups. Notably, Group E emerged as the highest performing group, indicating potential advantages or contributing factors that foster academic success. Addressing racial disparities and promoting equitable education should remain a priority.
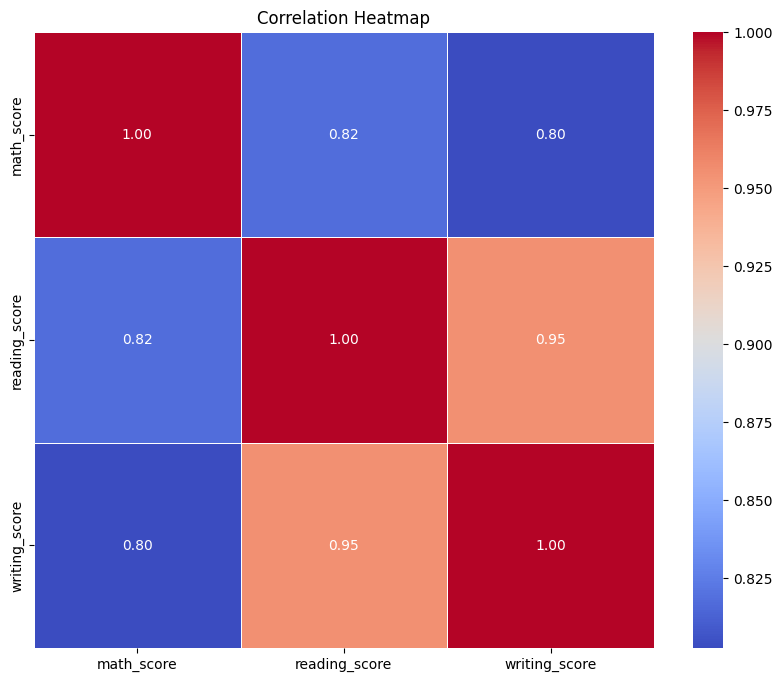
A correlation of test performance in math. reading and writing values shows below.
This visual representation provides a clear overview of the writing scores across different parental education levels and enables us to identify any significant variations or outliers.
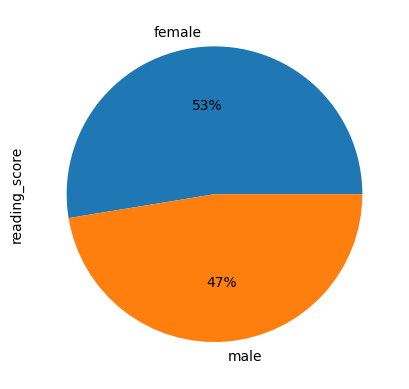
A reading score analysis grouped by gender witnessed the below graph;
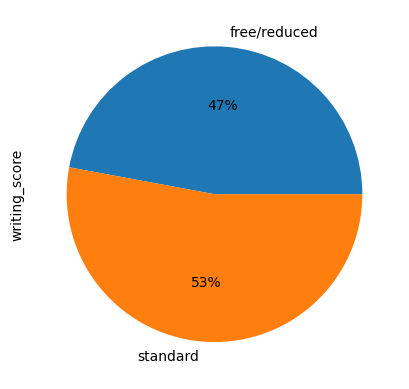
A writing score grouped by lunch provision showed this graph below;
A bar chat of race across the math score showed;
A mean of the total performance score by gender reveals how more females had an overall better mean performance than the males.
In the mean Total Performance, provision of a standard lunch was vital to the success of students.
Insights and Analysis:
The analysis of student performance provides valuable insights into the complex interplay of factors influencing academic success. By acknowledging and addressing gender disparities, ensuring equitable access to nutritious meals, supporting students from diverse parental education backgrounds, and promoting educational equity among racial groups, we can foster an inclusive and supportive educational environment. These insights highlight the need for targeted interventions, collaborations, and policy changes to promote equitable education for all students.
Conclusion:
Our analysis of student performance offers a comprehensive understanding of the factors that influence academic success. By recognizing these patterns and taking action, we can work towards creating a more equitable and inclusive educational system. Join us in advocating for policies and initiatives that empower all students, regardless of their backgrounds, to reach their full potential.
Call to Action:
Reflect on the insights presented in this analysis and let’s consider our role in promoting educational equity. Together, we can advocate for change, support initiatives that address disparities, and create an educational environment where every student has an equal opportunity to thrive. Let’s collaborate to build a brighter future through equitable education.
Below is a tableau presentation of all the main factors against Average Total performance.
Suggestions to the Client:
1. Gender Disparity:
Implement targeted interventions to address the gender disparity in student performance.
Encourage and support male students to improve their academic performance.
2. Test Preparation Course:
Expand access to the test preparation course to more students.
Promote the importance of test preparation and encourage students to participate in the course.
3. Parental Involvement and Education:
Develop programs to engage parents and enhance their involvement in their children’s education.
Provide resources and support for parents to improve their own education levels, especially for those with lower educational backgrounds.
4. Identify Underlying Factors:
Conduct further analysis to identify the reasons behind the gender disparity and explore potential solutions.
Investigate the specific content and delivery of the test preparation course to optimize its effectiveness.
5. Continuous Monitoring and Evaluation:
Establish an ongoing monitoring and evaluation system to track the impact of interventions and identify areas for improvement.
Regularly assess student performance data to identify emerging trends and implement timely interventions.
By addressing the gender disparity, expanding access to the test preparation course, promoting parental involvement, and implementing a continuous monitoring and evaluation process, the NGO can work towards improving student performance and reducing disparities among students. These suggested solutions aim to create a more equitable and supportive educational environment.
Below is a link to the whole project;
https://colab.research.google.com/drive/1pslDNV0DH94Y8QFMQa9a5XdR-JO2OMie#scrollTo=ycICnC3WLdcS